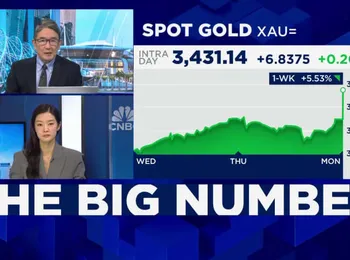
Gold is coiling in a symmetrical triangle, and that means the market is at a crossroads. The breakout candle you just saw is not just a random spike; it’s supported by volatility signals (Bollinger Bands), momentum (MACD), and fundamentals (Powell’s dovish stance). If price clears $3,418 convincingly, you’re likely looking at a run toward $3,430, and possibly even $3,500. At the same time, you can’t forget the neutral nature of a symmetrical triangle. If the breakout fails and price breaks below $3,313, the structure tilts bearish, and you could see a downside pullback to deeper support instead.